What are “Affordable Homes”?

Affordable Homes Defined
Affordable homes are homes for sale or rent for those whose needs are not met by the housing market, because market rates are not affordable for local people. The policy is an attempt to align housing costs more closely with local wages than is achievable in an open market . The need for affordable homes is increased by the decline in social housing historically provided by local authorities.
Overall, the government has defined “affordable home” as a home which is offered at least 20% below its rent or sale price on the open market.
The government offers grants to support development of affordable homes provided the homes remain at an affordable price for future eligible households.
However, for areas like Tisbury, where market prices are already very high, even a 20% discount does not make homes affordable for many local people.
Nadder Community Land Trust’s objective is to make homes as affordable as they can be, meaning that they are offered more than 20% below their market rent or sale price if at all possible.
Click here to read the Government’s definition of “affordable housing” as set out in the National Planning Policy Framework issued in July 2021.
HOW AFFORDABLE ARE HOUSE PRICES IN OUR AREA COMPARE WITH OTHER PARTS OF THE UK?
The map below shows how affordable house prices are across the UK, when compared with average household income in each area. The ratio shows median house prices for all types of house divided by median earnings in each area. For example a ratio of ‘5’ indicates that typically house prices are five times annual earnings.
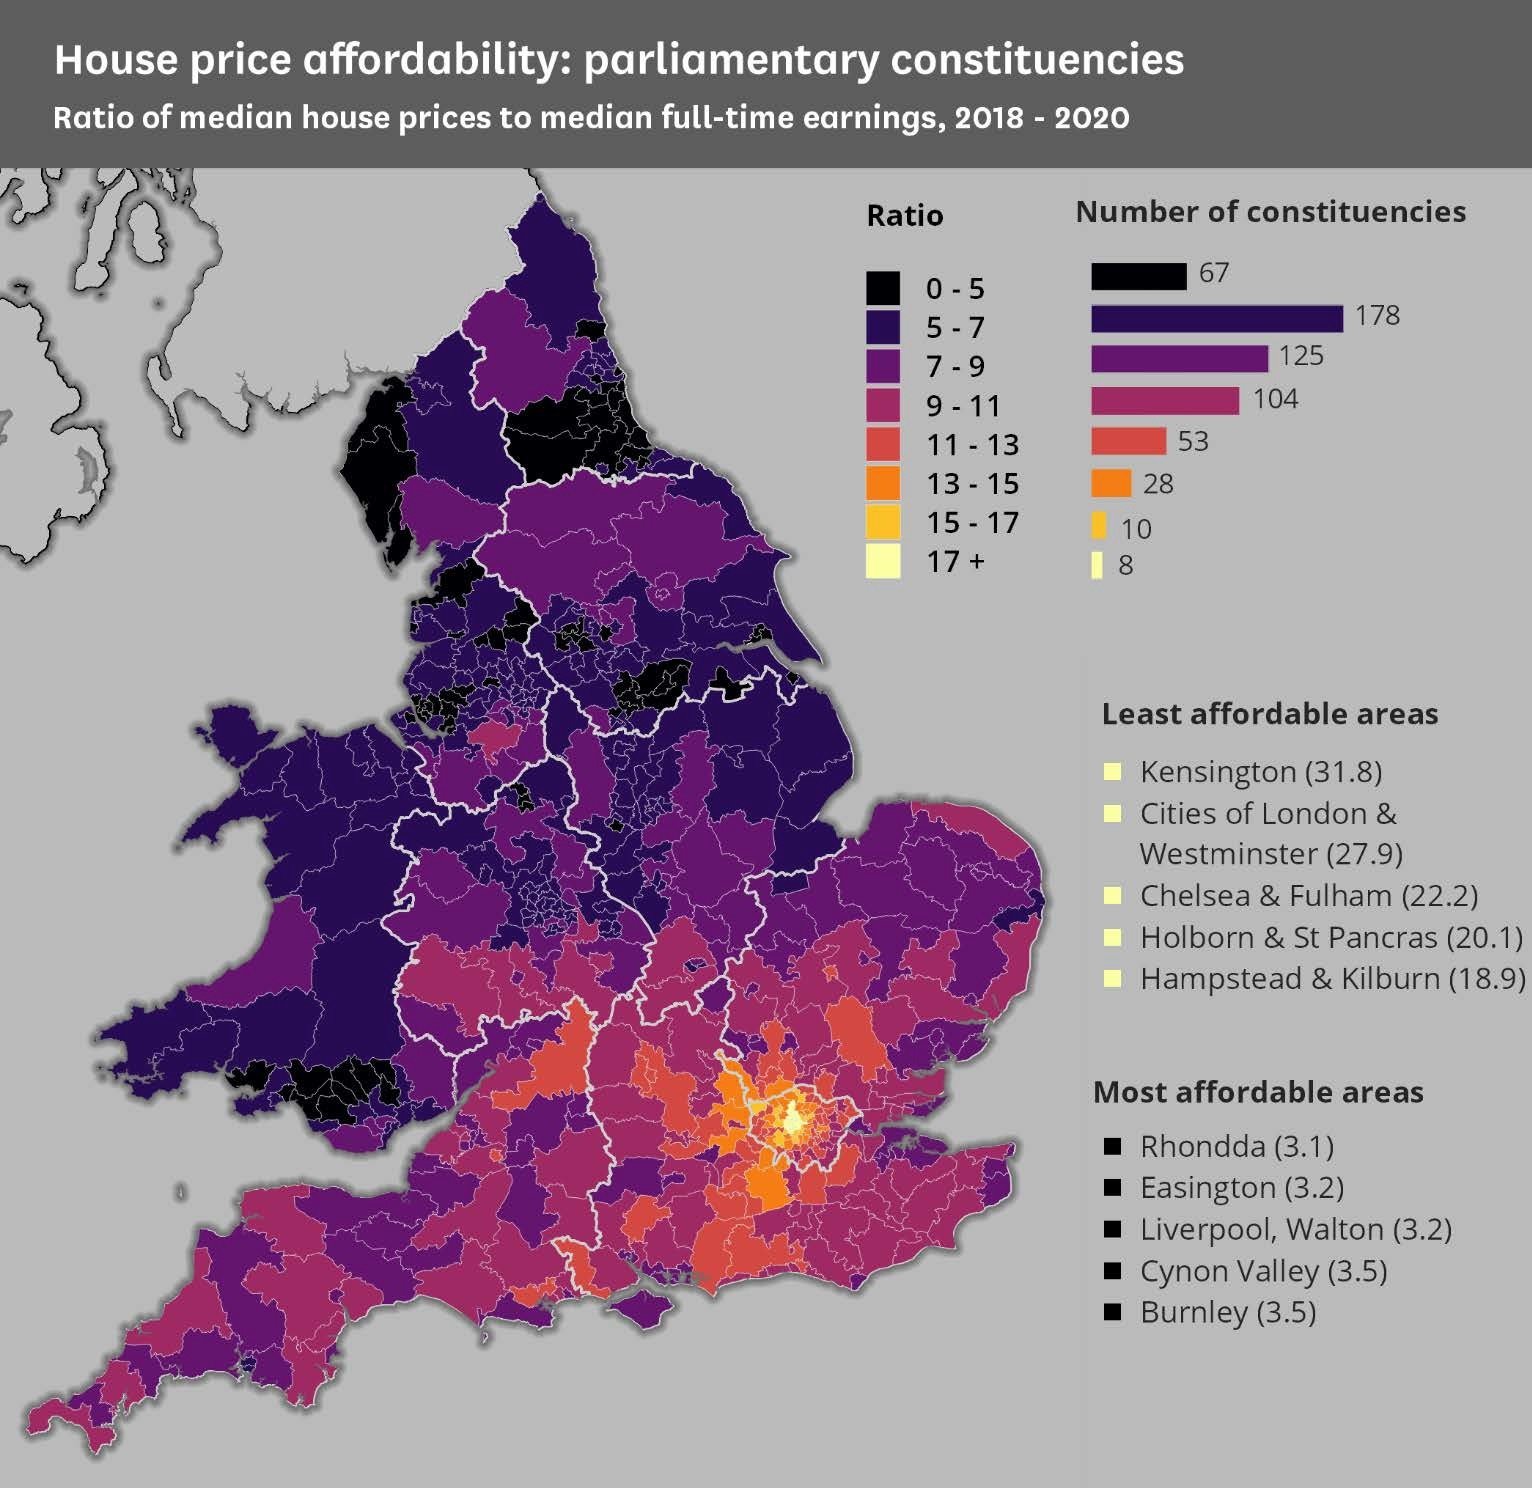
Notes: Ratios are calculated from a three-year average of median earnings and median house prices between 2017/18 and 2019/20. Earnings figures are annualised weekly earnings of a full-time employee living in the constituency. The median is the point at which half of earnings are higher and half are lower.
Map reproduced from House of Commons BRIEFING PAPER Number 07747 dated 19 April 2021©. Crown copyright. House of Commons Library (OS) 100040654 (2021) Reproduced by kind permission. Contains Parliamentary information licensed under the Open Parliament Licence v3.0.
Sources: Annual Survey of Hours and Earnings (ASHE), via ONS Nomis; ONS, House Price Statistics for Small Areas, Dataset 24

How affordable are rents in our area compared with other parts of the UK?
The map below shows how affordable house rentals are across the UK, when compared with household income in each area. The ratio shows median monthly rentals for a 2-bed home in each area as a proportion of median monthly earnings. For example 25% indicates that typically one quarter of monthly income goes to pay the rent..

Notes: Monthly earnings are scaled-up weekly earnings of full-time employees living in the local authority. The median is the point at which half of earnings are higher and half are lower. Median rents are based on a survey sample which does not include Housing Benefit recipients. This analysis compares earnings figures for the year to March 2020 with rents figures for the year to September 2020, due to local authority boundary changes in this period.
Map reproduced from House of Commons BRIEFING PAPER Number 07747 dated 19 April 2021©. Crown copyright. House of Commons Library (OS) 100040654 (2021) Reproduced by kind permission. Contains Parliamentary information licensed under the Open Parliament Licence v3.0.
Sources: Annual Survey of Hours and Earnings (ASHE), via ONS Nomis; ONS, Private rental market summary statistics in England: October 2019 to September 2020